
BEST DEER FEEDERS • OBSERVATION GUIDE
Deer Feeding Times: 7 Smart Checks for a Local Chart
Build a local observation record. Keep daylight, wildlife behavior and equipment schedules separate.
Build your observation setup
Affiliate disclosure: As an Amazon Associate, we earn from qualifying purchases. Confirm the model, seller, current price and included accessories on Amazon.
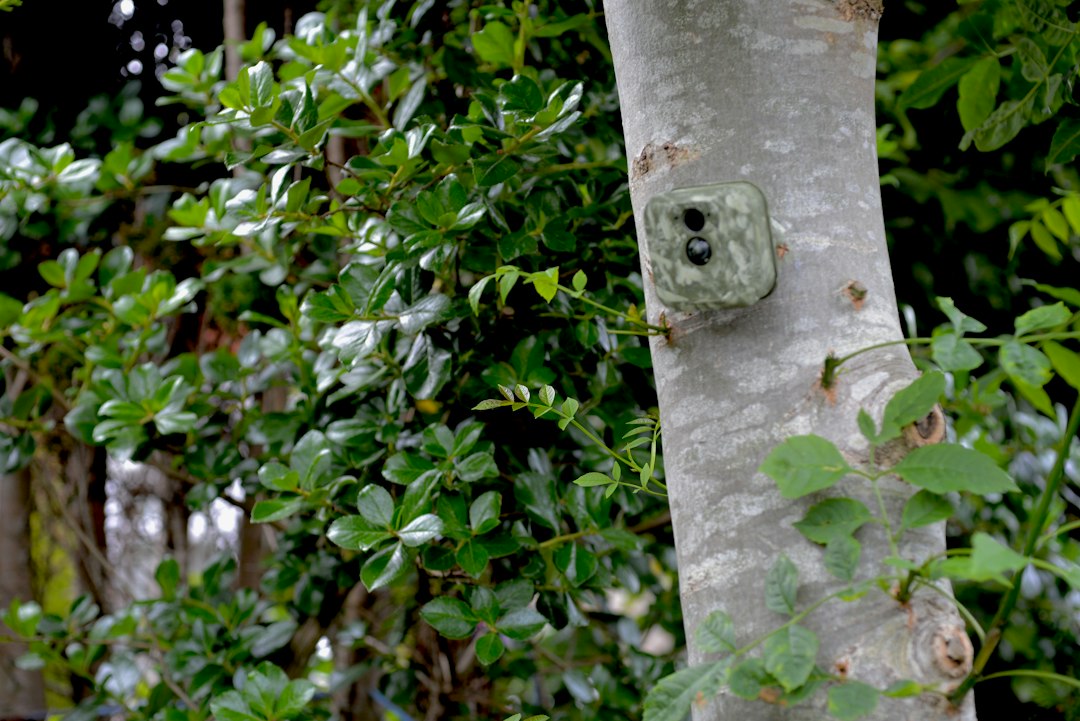
Record actual deer visits
A trail camera can support a dated local record. Use equipment you already own first. This is an illustrative setup image, not a photograph of a specific recommended Amazon product.
Browse deer trail cameras on Amazon →Amazon search link: compare current models, power, storage and service requirements.
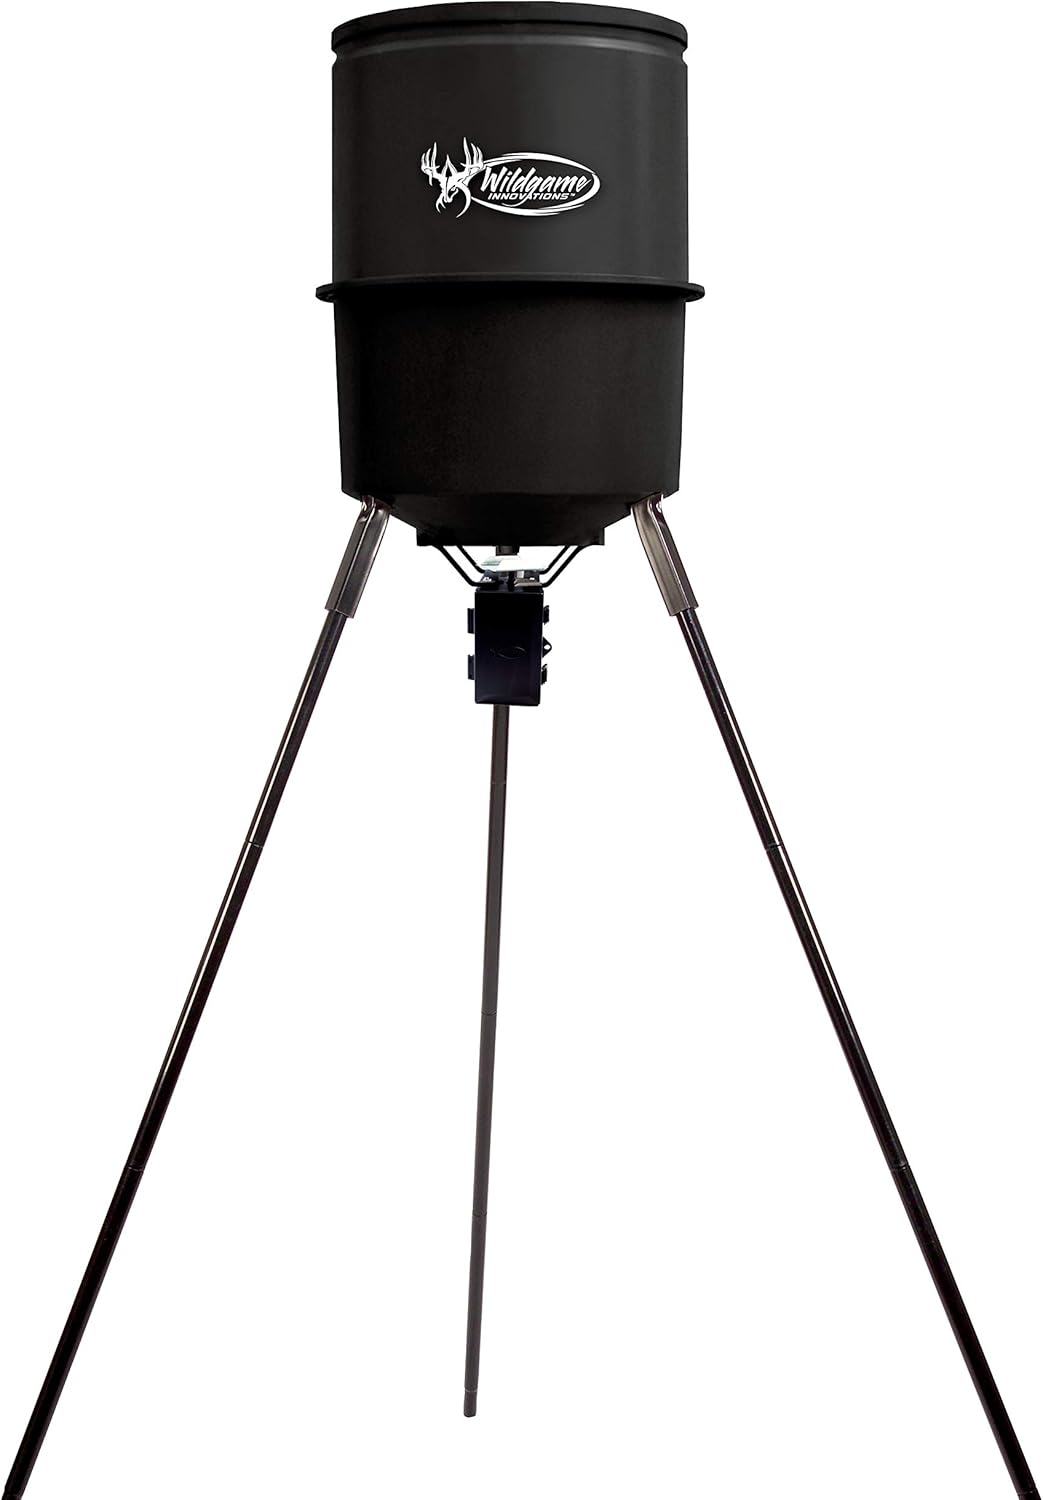
Need a timed feeder as well?
Only consider a feeder where its use is permitted. A timer schedules equipment; it cannot guarantee deer arrivals. Compare the complete buying guide before choosing.
Check Quick-Set 225 on Amazon →In this guide • jump to what you need
Deer feeding times are not a dependable appointment schedule. Dawn and dusk are useful starting points, but the activity you observe depends on the place, date, individual animals and how you collected the information. A useful deer feeding chart makes those limits visible instead of offering a precise-looking forecast without local evidence.
This guide shows you how to build a local chart using sunrise and sunset references, camera observations and a simple visit log. It also explains what moon-phase research does—and does not—tell you. The goal is to help you make better observations before adjusting equipment or planning a sit, not to promise when a particular deer will appear.
Research method: this is a research-based guide using named studies, university resources and an attributed owner account. We did not collect the field datasets described below or test a nationwide prediction system. The sample chart contains an explicitly labelled solar-time example; it does not contain invented deer arrivals.
Affiliate disclosure: As an Amazon Associate, we earn from qualifying purchases. Some related buying guides contain affiliate links. You can build the observation chart described here without buying a new feeder or cellular camera. Start with the equipment and lawful observation opportunities you already have.
Deer feeding times quick answer
White-tailed deer often show activity around sunrise and sunset, but feeding and movement also occur at other times. Use local daylight references as context, then record actual visits and camera uptime. A moon chart or ZIP code cannot establish a guaranteed arrival time for deer on your property. The equipment's programmed run time is a separate record.
If you need to set a motor schedule, use our feeder timer programming guide. This page answers a different question: how to understand and record deer activity. Keeping the two records separate helps you avoid treating the time a motor runs as the time an animal actually feeds.
| Chart entry | What it means | What it does not establish |
|---|---|---|
| Sunrise / sunset | Location-and-date daylight reference | Exact deer arrival |
| Camera visit | Recorded presence under stated method | All activity outside the frame |
| Possible feeding posture | A classified observation | Verified food intake |
| Motor event | Equipment operation | An animal response |
| Moon / solunar window | Theory or reference to compare | A guaranteed local forecast |
First distinguish movement, feeding and feeder operation
Movement means an animal changes position. Feeding means an animal engages in a feeding behavior; even a camera image may only show a posture consistent with that behavior. Feeder operation means equipment releases material. These records can overlap, but they are not interchangeable. A motor event with no deer in view is not a feeding observation, and a passing deer is not automatically a feeding visit.
Use plain labels in your log. “Deer visible,” “head-down posture,” “motor event,” and “outside camera view” are more useful than confidently writing “feeding” for every photograph. You do not need to identify every detail to keep a helpful record. You do need to avoid adding an interpretation that the image or observation cannot support.
This distinction also matters when reading research. A GPS collar can inform a movement study, while camera photographs at baited locations can inform a feeding-posture study. Their results answer different questions. If you combine them without noticing the measured outcome, you can create an apparent contradiction or a stronger claim than either study supports.
For your property, decide what the chart will summarize before collecting observations. A chart of recorded visits can be useful, but it should be named that way. A chart of motor settings is also useful, but belongs with the equipment record. Do not label either one an accurate deer-feeding forecast unless you have a validated basis for that specific prediction.
A local deer feeding chart you can actually use
The table below is an observation framework. It deliberately leaves deer-visit fields empty. Fill them with dated records from your own location, and retain days when the camera failed or was unavailable. Those gaps are part of the evidence. A chart that quietly removes them can make a weak pattern appear stronger than it is.
| Local record | Required reference | Your observation | Interpretation limit |
|---|---|---|---|
| Date / site / time zone | Keep together on every record | Enter your actual location label | Do not mix clocks silently |
| Sunrise / sunset | Use the local source and date | Enter solar times | Not a biological prediction |
| Camera-active periods | Record gaps explicitly | Enter verified uptime | Missing images ≠ no deer |
| Visit groups | Use a stated counting rule | Enter actual grouped records | Not a population estimate |
| Motor changes | Record event and setting | Enter actual equipment record | Not proof of feeding |
Choose a location label that is meaningful to you without publishing precise private property coordinates. For example, “north field camera” may be enough for a public article or shared worksheet. In your private notes, preserve the actual location and settings needed to interpret the record. The aim is to keep observations comparable while avoiding unnecessary disclosure of a sensitive or private site.
Record the date and local time zone together. A clock reading without a date or zone may be difficult to interpret later, especially around seasonal clock changes or when comparing cameras. If one camera's clock is wrong, document the known error and how you corrected the interpretation. Do not silently alter records in a way that makes the original evidence impossible to reconstruct.
For sunrise and sunset, retain the source and its assumptions. Some solar tables use standard time and instruct readers to add an hour when daylight time applies. An apparent one-hour difference may be a time-reference problem rather than an animal-behavior change. Check that before drawing a conclusion about earlier or later visits.
A real solar-time example, not a deer-arrival prediction
The US Naval Observatory's State College, Pennsylvania table for 2026 lists October 11 sunrise as 06:19 and sunset as 17:37 in its UTC−5 base reference. Its daylight-time instruction adds one hour when applicable: 07:19 and 18:37 locally for that example date. These are solar times, not deer feeding times or legal shooting hours.
The useful lesson is how the label is constructed. Location, date, base time reference and daylight adjustment all remain visible. Anyone reviewing the example can see what the numbers represent. A chart that simply prints “best feeding time: 7:19” would remove that context and turn an astronomical reference into an unsupported biological claim.
Use a fresh calculation or appropriate table for your own date and location. Do not carry the Pennsylvania example to Alabama, Mississippi, Texas or another state. Even within a state, the selected coordinates and time convention matter. Your chart can use local solar references without pretending that they reveal the local herd's exact behavior.
Hunting hours require a separate current rule check. Do not substitute sunrise, civil twilight or a commercial app's colored window for the regulations that apply to your species, season and land. Keep that rule source alongside your planning notes. This article explains observation methods and does not establish permission to hunt or feed at a particular time.
Decision chart: what can your current evidence support?
Start with the records you actually have. If there is no usable local observation period, your chart is a planning template. If you have photographs but do not know when the camera was active, describe the visits without making a complete day-versus-night comparison. If clocks and uptime are known, a more useful local summary becomes possible.
Use a blank planning template; do not forecast.
Describe available images and preserve the gap.
Group actual visits with a stated rule.
Interpret within the site and monitored period.
Daylight references and observed visits are different data. Keep equipment events in a separate column.
That sequence is not a statistical validation procedure. It is a way to avoid obvious interpretation mistakes. The decision chart should lead you to a more honest description of your evidence, even when that description is “not enough information yet.” A reliable next step is more useful than an impressive percentage produced from missing or mismatched records.
What the research says about deer feeding times and moon charts
Mississippi State University's Lunar Legends publication, P4068 summarizes GPS observations of 48 white-tailed bucks over two years in central Mississippi, with fifteen-minute fixes during September through February. Its overview reports no moon-phase or moon-position effect on the studied activity outcomes. This is strong context against a guaranteed lunar timetable, but it is not a census of every deer or every feeding setting.
The important reading habit is to keep the outcome and population attached to the finding. These were bucks in a particular region and study design. The publication evaluates activity and bedding, rather than demonstrating that a feeder will trigger a visit at a certain minute. You can use the evidence to question confident lunar forecasts without claiming that every possible light-related behavior was settled by one dataset.
In Lashley and colleagues' 2014 PLOS ONE study, researchers analyzed 40,540 camera photographs from baited sites at Fort Bragg, North Carolina, during August 2011 and 2012. Feeding posture and vigilance varied with light and social context; moonlit nocturnal hours were associated with more feeding posture. The count refers to photographs, not that many independent deer, and the endpoint differs from landscape movement.
A third useful example is the University of Maryland Extension's Wye Research and Education Center account. Its 2021–2022 soybean-field observations describe dawn/dusk and nocturnal grazing patterns, with no significant moon-phase or pressure effects in the reported model. Crop-field detections are informative, but do not establish a nationwide arrival rule or a fixed post-rain waiting period for every hunting property.
| Evidence | Population / setting | Measured outcome | How to use it |
|---|---|---|---|
| MSU • P4068 | 48 bucks • central Mississippi | GPS movement / bedding | Question a guaranteed lunar timetable |
| PLOS ONE • 2014 | North Carolina • summer baited sites | Feeding posture / vigilance | Keep endpoint and season visible |
| Maryland Extension | Soybean-field observations | Camera-recorded grazing context | Avoid nationwide clock-time rules |
The studies are useful together because they show why “the moon affects deer” is an incomplete question. Which deer? Which behavior? Which season and setting? What was measured? An article that preserves those questions gives the reader a better understanding than one that forces every study into a simple yes-or-no slogan.
For practical planning, avoid making a lunar chart the only reason you believe a local window will be good. Look for repeated observations from the relevant site, and keep the uncertainty visible. If you enjoy comparing moon information with your notes, record it as a variable rather than writing the chart's prediction into the observation column.
Deer feeding times by ZIP code: what location data can do
A ZIP code can help you begin locating a place, but it is not a biological sensor. It does not record the deer using a specific opening, their behavior around your camera, or whether your equipment was working. Be skeptical of an interface that converts a ZIP code into a highly precise arrival probability without explaining the underlying data and validation.
Location-based daylight information is still useful. It lets you interpret a recorded visit relative to sunrise or sunset rather than only by a wall-clock number. That comparison can be more meaningful across dates. The distinction is straightforward: solar context can be calculated for a location and date, while the local activity record must come from actual observations.
If you use an app, inspect what its chart represents. Does it show sunrise, moon phase, a solunar prediction, your own camera history, or a combination? A polished screen may place all of those together. Read the labels before treating a colored period as observed behavior. Keep a screenshot or note of the source version if you use it in your private records.
Do not create a separate state or ZIP-code forecast merely by changing the place name in a generic article. A useful local page needs local evidence and the appropriate current rules. This guide provides a method that readers in different US regions can adapt without inventing a dataset for each one.
Seven smart checks before interpreting your local chart
1. Is the camera clock aligned with your time reference?
Check the displayed date and clock against the local reference you will use in the log. Record any known offset. If several devices are involved, label each one and verify them independently. A photograph that looks early or late may simply come from a camera using a different time convention. Resolve that first, before attributing the difference to wildlife behavior.
Keep the original files when possible, including the date stamp or metadata your workflow uses. If you correct a known clock offset in a spreadsheet, keep a separate note of the correction. That preserves the distinction between the original record and your interpretation. It also makes it easier to explain the chart to another person without reconstructing the process from memory.
2. Was the camera active throughout the comparison period?
Write down when the camera was installed, unavailable or known to have a problem. A missing photograph does not prove no deer was present. The camera might have been off, out of position or unable to record the event. If you cannot establish uptime, describe the available photographs as observations rather than a complete account of activity.
When comparing windows, keep the opportunity to observe in view. Ten visits during a fully monitored evening and five during a partly monitored morning are not automatically evidence that evenings are twice as active. The observation periods differ. You do not need a sophisticated model to notice that mismatch; a simple uptime note prevents an overconfident comparison.
3. What are you counting as one visit?
Decide on a grouping rule before summarizing photographs. A burst of images from one animal remaining nearby should not automatically become multiple independent visits. For a basic personal log, you might choose a stated time-gap rule for grouping consecutive detections. The rule is an editorial definition for your record, not a universal biological standard, and it should remain consistent within a comparison.
If you change the rule, recalculate the compared records consistently or keep the two summaries separate. Otherwise, the chart may show a change created by your method. Label the counts as visits, image groups or detections according to what you actually counted. Do not silently convert them into deer population estimates.
4. Does the image show feeding or only presence?
Use a category for uncertain observations. The animal might be partially obscured, passing through or interacting outside the frame. Writing “unclear” protects the integrity of the chart. It is better than filling every row with a confident feeding label to make the record look complete.
For a household or property-planning log, simple categories can be sufficient: visible deer, possible feeding posture, moving through and unclear. The more demanding your question, the more careful the definition needs to be. Do not claim that a casual classification repeats the methods of a peer-reviewed study simply because it uses a camera and a spreadsheet.
5. Were equipment settings or the observation position changed?
Record changes to the camera location, framing, sensitivity or recording mode. Also note changes to a feeder schedule, if feeding is lawful and a feeder is part of the site. A change in recorded visits may reflect a changed observation setup. The chart should show that context rather than assuming the animals alone changed their behavior.
If you want to learn from a specific adjustment, avoid changing several things at once without documenting them. Keep the earlier settings and the date of the change. This is a practical recordkeeping recommendation, not proof that one adjustment caused a later pattern. You can improve the comparison while still acknowledging other factors.
6. Is the record recent and relevant to the question?
A collection from another season or a different part of the property can be interesting without answering today's question. Name the period and site whenever you summarize it. If you combine records, say which ones were combined and why. Do not hide a change in location behind a single chart title.
Use older observations as context rather than pretending they are a current forecast. They may help identify questions to investigate again. A practical seasonal review can ask whether the same location remains observable, whether equipment and settings changed, and whether the latest records resemble the earlier pattern. It does not need to promise a repeated arrival window.
7. Are local rules being kept separate from activity estimates?
An animal appearing at a certain time does not establish permission to hunt, bait or feed. Keep the applicable regulations in a separate planning note. If the land type, county or season changes, verify the relevant current agency information again. A chart can support an observation decision without replacing the legal decision.
Where feeding is restricted, a camera-only log may still be a useful approach if the observation and placement are permitted. Do not assume you need to introduce feed to collect information. The chart should help you understand what you can observe lawfully, not encourage an equipment purchase before the local-use question is resolved.
Build your first chart step by step
Choose one defined observation location and a manageable initial period. A two-week pilot can be a practical recordkeeping starting point, but it is not a validated minimum for predicting deer behavior. The right duration for a research claim would require a more rigorous design. For a personal log, begin with a period you can document consistently and extend it when important gaps remain.
Prepare the worksheet before you review the images. Include date, camera identifier, local time zone, source of daylight references, active hours, recorded visits, equipment changes and notes. Decide what belongs in the observation columns and what belongs in the interpretation column. That separation makes it harder to accidentally copy an expectation into the evidence.
Review images systematically and retain uncertain records. Use the same grouping and behavior labels throughout the period. If a day is missing, record why when you know. If the reason is unknown, say so. Your final chart should describe the available record, including its weaknesses, rather than silently presenting an idealized version of the site.
Summarize by relevant windows only after the records are organized. You might examine visits near dawn, during the middle of the day, near dusk and at night, provided the time references and observation opportunities are comparable. Define any chosen window widths explicitly. The categories are a tool for your summary, not evidence that deer follow those boundaries.
Write one cautious interpretation beside each result. For example, “Most grouped visits recorded during this monitored period were after sunset” is more defensible than “The deer only feed at night.” The first refers to the actual record. The second makes a broad claim about animals and behavior that the camera may not have observed completely.
- Define
Choose site, period, clock basis and observation categories.
- Record
Keep real visits, uptime, unknowns and equipment changes.
- Group
Apply a stated visit rule consistently.
- Interpret
Describe the monitored record before proposing a cause.
| Date / zone | Camera / uptime | Solar source | Visit / category | Changes / evidence |
|---|---|---|---|---|
| Enter actual record | Record gaps | Local date and location | Keep uncertain labels | Preserve original image |
| Do not invent a sample | Unknown is acceptable | Not an arrival forecast | State grouping rule | Separate observation from interpretation |
How to read an apparently nighttime-only pattern
Begin with the observation setup. Check the clock, monitoring period and whether the camera covers the same area during the compared windows. A nighttime-heavy set of photos may be a real local observation, but it is not automatically an explanation of why the animals are present then. Verify the record before looking for a cause.
Next distinguish all detected deer from the individual animal you care about. If the goal is understanding one recognizable buck, pooled detections from other animals may answer a different question. Describe identification uncertainty rather than forcing unclear images into a target-animal category. If you cannot reliably distinguish individuals, keep the summary at the level the evidence supports.
Avoid assuming a timer change will necessarily move the observed visits into daylight. That is a hypothesis to examine, not an established outcome. If a lawful adjustment is made, log it and keep the before-and-after periods visible. Other conditions may also change, and an observational comparison alone does not isolate a cause.
Sometimes the useful conclusion is that the available record is insufficient to guide a purchase or major setup change. You can continue observing, improve documentation or ask a local qualified source about the broader management context. The absence of a neat answer is not a failure of the chart. It is a reason to avoid spending money on a promised result the evidence does not support.
Weather, habitat and pressure: context rather than magic thresholds
Write down the context you can actually document. A dated weather observation, a known equipment change or a recorded visit to the location is more useful than an after-the-fact story assembled to explain every photo. If a weather source is used, preserve its location and time basis. The conditions it reports may not represent the exact spot in the image.
Do not import a numeric relationship from one study setting as a nationwide hunting rule. The Maryland example concerned particular crop fields, observation periods and model outcomes. The broader editorial lesson is to preserve the context of evidence. The chart you create should record local observations and clearly distinguish them from hypotheses about weather or disturbance.
The same caution applies to habitat and pressure. If you describe a change in access or a known disturbance, give the date and explain what was recorded. Do not infer a complete behavioral cause from a few photographs. Keep competing explanations open when the evidence cannot separate them.
If you enjoy comparing variables, limit the number you track initially. A clear small log that you maintain is more useful than a complicated template filled inconsistently. Start with the records necessary to interpret time and observation opportunity; add context only when you can capture it reliably. The goal is learning from the site, not producing a dashboard with a decorative precision score.
An owner experience can suggest a question, not prove a timetable
In a March 2020 NJ Woods & Water comment, mazzgolf described a dawn timer and regular deer visits at a homemade bucket feeder. The location and experience are limited to that account. We do not treat it as a controlled experiment, a current commercial-model test or evidence that a dawn schedule guarantees the same response elsewhere.
What the story usefully suggests is a question: what happens at your site when equipment is used in a documented way? Answering that question requires your own observations and the appropriate legal context. It does not require borrowing the owner's outcome as your prediction. Keep the anecdote attributed and the proposed investigation separate.
When you share your own future observations, include the model or camera setup, date range, location context, known gaps and grouping rule. Avoid stating an exact promise to another reader whose circumstances are unknown. A useful real-life report helps someone understand your conditions and method, even when it cannot supply a universal answer.
Videos and expert listening for further research
The resource sheet includes an official Deer University episode on lunar tables and a Mossy Oak video featuring Dr. Bronson Strickland. Their pages identify the topic and experts. We reviewed the page descriptions, not complete playback, so this guide does not present unverified quotations or timestamps from either resource.
Deer University #401
MSU researchers discuss lunar-table hypotheses. March 13, 2025. Page description reviewed; audio not audited.
Open expert episode ↗Solunar-table explanation
Dr. Bronson Strickland on Mossy Oak GO. Use named written studies for this article’s evidence claims.
Open supporting video ↗Use the named written studies for the specific evidence claims in this article. The listening links are an opportunity to explore the researchers' explanations further. If you take notes from a video or podcast, distinguish the speaker's interpretation from the study's measured findings, and keep the episode title and date so the source can be traced later.
When observation should lead to an equipment decision
Buy equipment to solve a documented limitation. If you cannot interpret visits because the camera record is unavailable or unreliable, first identify what information is missing. It may be a clock check, a better recordkeeping habit or a placement question. A new cellular system is one possible tool, not the automatic answer to every uncertain chart.
If a permitted feeding setup is part of your plan, separate the feeder's delivery needs from the observation needs. A timed motor, a camera and remote controls perform different jobs. Decide which job requires improvement. Our corn feeder buying guide compares equipment choices; this page should help you decide whether an equipment change is justified at all.
For readers specifically evaluating camera-assisted controls, the camera and app guide explains that separate system. Check compatible hardware and service requirements on the actual listing. Do not buy a feeder alone expecting every remote capability shown in a combined camera demonstration.
Three chart-reading examples without invented field data
The following situations are hypothetical examples of interpretation problems. They contain no fabricated deer counts, arrival times or test outcomes. Use them to see how a chart can remain helpful even when its evidence is incomplete. The same reasoning applies whether your log is on paper, in a spreadsheet or inside a camera app.
Example A: a clock problem looks like an activity change
Suppose you compare two image folders and notice that the later folder appears to show earlier visits. Before writing a biological explanation, check the cameras' time conventions and any known setting changes. If one folder uses a different clock reference, the apparent shift may need a correction note. Preserve the original stamps and record how you interpret them rather than replacing them silently.
If the time reference cannot be established, narrow the conclusion. You can describe the photographs and their printed stamps without claiming a precise change relative to sunrise. That is still a useful record. The next practical step is to establish the clock basis for future observations, so the next comparison has a clearer foundation.
This example shows why the chart asks for a date and zone rather than only an hour. It is easy to mistake a tidy column of numbers for a consistent time reference. Consistency is something you verify, not something the spreadsheet layout guarantees. The method should make that check visible before it invites an interpretation.
Example B: repeated photographs become exaggerated visit counts
Imagine reviewing a long series of photographs from an animal remaining in the frame. If each image becomes a separate visit in the chart, the summary may overstate the number of recorded events. A stated grouping rule helps prevent that. You should choose it before comparing windows and apply it consistently, while keeping the original image collection available.
The corrected label might be “grouped detections” rather than “individual deer.” That wording matters. You may have enough information to group a sequence without being able to identify every animal. A clear count definition lets someone else understand the record and prevents the total from becoming a population estimate by implication.
If your goal changes, the method may also need to change. A record useful for noting when something entered the frame might not answer how long a recognizable individual spent feeding. Do not force the first chart to answer the second question. Identify the new information needed and state what the original collection can still support.
Example C: an equipment purchase is proposed before the gap is understood
Suppose a reader thinks the lack of daylight images means a new feeder or camera will solve the problem. Start by identifying the missing evidence. Was the camera active? Is its clock known? Does it cover the intended area? Were settings or placement changed? The first step may be a recordkeeping improvement rather than a purchase.
If the gap remains a genuine equipment limitation, write a short purchase requirement that names the task. For example, the need might concern access to observations or a particular remote control function. Then check the complete system and its compatibility. Do not assume a product's attractive feature list establishes that it will change animal behavior or produce the desired photographs.
An evidence-led purchase can still be a good purchase. The difference is that its purpose is explicit and measurable at the equipment level. You can check whether the requested function works without pretending that the animal outcome is guaranteed. That distinction protects the reader from buying a tool for a promise it does not establish.
How to share a useful local chart with another reader
Include the observation period, general location context, clock basis, camera-active periods and visit-grouping rule. Explain whether the chart records presence, possible feeding posture or another category. Identify known gaps and changes. If you include a conclusion, tie it to the recorded period rather than stating a permanent rule about the property.
Keep sensitive location details private unless sharing them is necessary and appropriate. A public chart can still explain the method using a general site label. What makes the report credible is traceable evidence and clear definitions, not the publication of exact coordinates. Retain the private original record so you can answer questions about how the summary was produced.
Invite corrections about the method and labels before treating the chart as a finished finding. Another reader may notice a time-reference issue or an inconsistent grouping rule. Fixing those details is more valuable than defending an overly confident interpretation. A chart improves when the process remains open to inspection and its conclusions remain proportional to the evidence.
Deer feeding times FAQs
When do deer feed?
Dawn and dusk are common activity reference points, but deer observations are not confined to those periods. Keep the site, date and measured behavior attached to the answer. A local camera chart can summarize recorded visits; it does not guarantee that a deer will appear or that every visible animal is feeding.
Can deer feed in the middle of the day?
A chart should allow for observations outside dawn and dusk rather than excluding them by design. Record what your evidence shows and keep the uncertainty visible. Do not turn a broad crepuscular pattern into a statement that other periods never matter. The absence of midday photos also needs an uptime and coverage check before interpretation.
Does a full moon guarantee better deer movement?
No guaranteed movement forecast follows from the research reviewed here. The MSU GPS summary, North Carolina baited-site posture study and Maryland crop-field observations have different settings and outcomes. Use their named findings within scope, rather than combining them into a promise about the next full moon at your property.
Can I get exact deer feeding times from my ZIP code?
A location helps select daylight references, but it does not supply local deer observations. Check whether an app presents calculated solar times, a solunar theory or actual camera records. Exact-looking numbers are not evidence of a validated animal-arrival forecast. Use a dated local log when the question concerns your specific site.
How long does it take deer to get used to a feeder?
The sources in this guide do not support a universal number of days or weeks. Record the first observed visits and subsequent activity if the setup is lawful, and preserve camera gaps. A first photograph is not proof that all local deer have accepted a feeder, and another owner's experience is not a countdown for your property.
Can I make deer visit only during daylight?
This guide does not establish that result. Equipment controls the availability or release schedule of material, while wildlife behavior must be observed separately. Do not treat a schedule change as a guaranteed behavioral outcome. If you make a lawful adjustment, document it and compare your records cautiously rather than promising a particular response.
How many photos count as one deer visit?
That depends on the rule used for your log. State how consecutive images are grouped, keep the rule consistent and distinguish image counts from visit counts. Neither count automatically estimates the number of individual deer. A clear method is more useful than an unexplained total.
Should I copy someone else's best feeding time?
Use it as a question to investigate, not as a local fact. Their date, equipment, location and observation method may differ from yours. Local solar references and actual records are a better foundation for your own chart. Your equipment-programming instructions should also come from the exact system you use.
Your next step: build a record before believing a forecast
Start with one location, a checked time reference and a blank log. Preserve camera uptime, recorded visits and important changes. Use dawn and dusk as context while allowing the evidence to show other windows. Keep predictions, observations and equipment events in separate columns. That simple structure can improve the quality of a local chart immediately, even though it cannot guarantee a deer arrival.
When reviewing the first period, write down what you know, what remains uncertain and what would improve the next record. Perhaps the clock needs correction, a day was missing or several photographs belong to one visit. Resolve those issues before buying equipment or adopting a more confident theory. A transparent chart is useful because the reader can see how its conclusions were reached.
Sources and limitations
Source pages were reviewed on October 11, 2026. The guide links to MSU Extension P4068, the named PLOS ONE paper, University of Maryland Extension, USNO solar data and the attributed owner discussion. It does not include firsthand field testing, a verified forecast model, or a legal-hours chart. Media descriptions were reviewed; full video and audio playback were not audited.
For local feeding and hunting rules, consult the current wildlife-agency information applicable to your state, county and land type. For nutrition or animal-health questions, seek qualified local guidance. This article's original contribution is a transparent observation framework and a careful comparison of evidence endpoints—not an invented set of feeding times for every US location.
Products mentioned in this guide
Amazon product B00IIULX9G
Check on Amazon ↗ASIN B00IIULX9G · Confirm price and availability on AmazonAs an Amazon Associate, we earn from qualifying purchases.


